

The flow of inventory goes up and down each month but like a roller coaster, follows the same path each year.
I must admit, I am a bit of a stat nut. I have detailed sales and inventory data for the Northern Virginia market for the last 15 years and additional sales data going back to 1975. (Using baseball parlance, I might border on being called a seamhead) Don’t worry, it is safe to read on. My blogs will never get too deep into a statistical interpretation of the market. I will leave that to others. Under the Market Stats tab above are several good resources for those interested in viewing a stunning array of charts and graphs. Here we will just review very simple data that can help a buyer or seller in deciding what time of year may be best to act.
First, when people ask is now a great time to buy or sell, they are really asking if the market is hot or cold and are thinking short term. Well, I think that is a fine question to ask but it should not be a major factor in deciding whether to buy or sell. No one can accurately predict the short term fluctuations of the market. (But I can’t resist and do have some thoughts on that below). A buying decision should be made when one feels the market in 5 to 7 years will be stronger than it is today. Unless one is a flipper, the short term movement is just noise. And selling is so personal that when a situation dictates a change in residence, one just needs to hire a great agent (preferably me) to help generate enough interest in the home to maximize the sales price and minimize the time on market and the transactional stress of moving.
However, the time of year one chooses to sell or buy may be a factor to consider. Depending on one’s goals, it may be best to buy or sell at a point in the year when inventory is plentiful or, conversely, there are sometimes advantages to buying or selling when inventory is low and many buyers and sellers are taking a few months off.
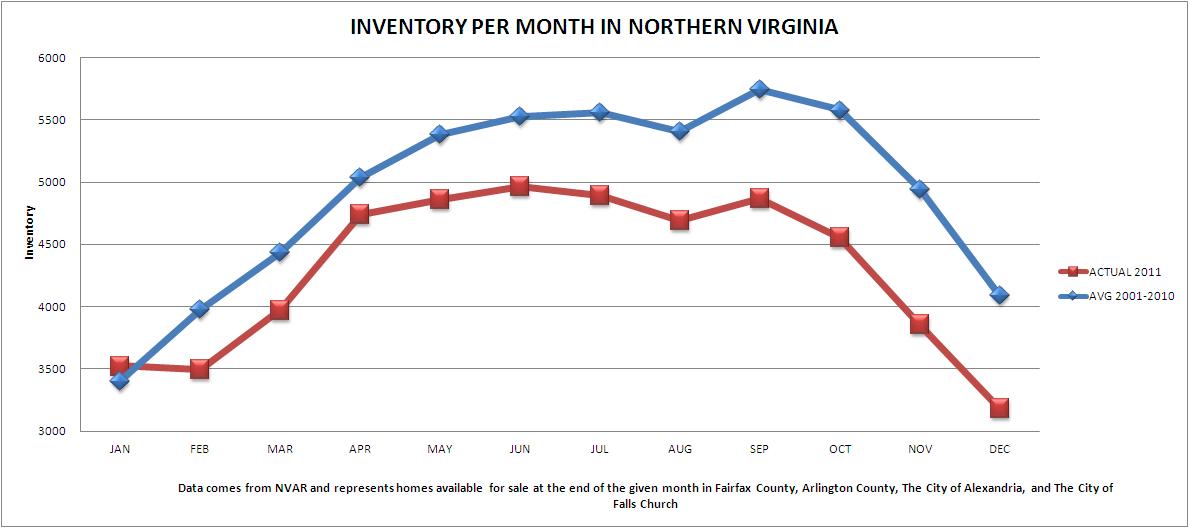
Unlike predicting price movement, the flow of inventory is fairly consistent year to year. The number of homes available and number sold may differ dramatically each year but the low points and high points are fairly consistent.
Look at the two charts below to see what I mean.

I have touched on some of the ways to play the annual flow of the sales and inventory in the blog “Moving Up is Hard to Do.” In general, for buyers if one is looking for a very specific type of home, the odds are increased during the peak inventory periods. For sellers, I often point out that the early part of the year when inventory is low, can be a far better time to sell than folks think. Many buyers start the year with a resolution to buy a house and those actually looking in the 1st quarter have slim pickings. A well priced and presented home really stands out in that environment.
One other note on the charts above. Notice that in 2011, except for January, inventory was substantially below the 10 year average. This trend is continuing this year and is one reason I believe that upward pressure on prices is likely. Until inventory expands back to more historical levels, the market should favor sellers.
If you would like to talk about your situation in detail and determine the best time of year for you, give me a call or shoot me an email. I am always happy to talk real estate.